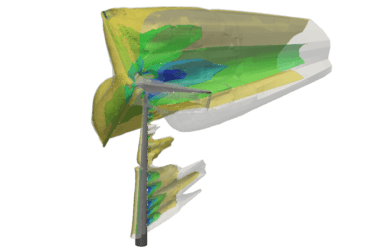
Wind load is one of the main concerns in construction codes. In addition to gravitational loads, earthquakes, and other factors, wind gusts-induced loads can be key factors that cause failure in structures. These failures are mostly due to lateral forces, induced turning moments, and pressure/suction on roof and walls, all of which deviate from the regular gravitational loads’ effects on buildings and other load-carrying structures.
What is Wind Load?
The wind is more or less influential in a given structural design case, depending on the geographical location; for example, coastal areas and plains are more affected by wind storms and fast wind gusts. Also, the structure’s height tallness of the structure, shape, and surrounding elements affect the wind flow and therefore the pressure distribution on the surfaces. Construction codes take into account all of these factors and deliver methods to calculate loads, always in approximate and conservative ways. However, if the engineering department needs to know the details of wind load over a structure with precision, because of unusual conditions or irregular structures, other methods must be used, such as wind tunnel testing or Computational Fluid Dynamics. In this article, I will make use of the latter to predict the pressure distribution over a set of oil storage tanks and make comparisons with the pressure distribution over a single one.
Wind Load Analysis Case Study: Wind Load Analysis of an Oil Storage Tank Farm
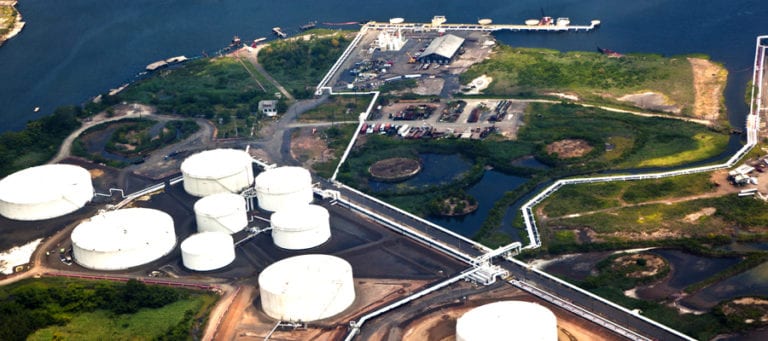
We have a 2600-square-meter tank farm located in an oil terminal at a bayside, with ten 15-meter tall tanks together in a space confined by a dam. This is a typical configuration for these facilities. The farm’s proximity to the sea and related lack of obstacles to gusts make wind loads a special concern. Also, care must be taken, since a failure in any of the oil storage tanks could lead to oil spills and contamination, so there is a high risk of negative environmental impact. It is highly desirable to have a maximum amount of knowledge of the real loads and produced stress state of the structural systems, for safety and reliability assessments.
We will use the wind gust speed of 36 m/s from the local construction code and apply it in a CFD wind tunnel model of the tank farm, then analyze the vortex formation, turbulence, and pressures generated on the tanks.
Tank Farm Simulation Modeling and Simulation
A virtual wind tunnel was modeled using a hexahedral-dominant mesh, with the tank farm in the middle. The mesh was computed in the SimScale platform, resulting in 1.5 million cells:
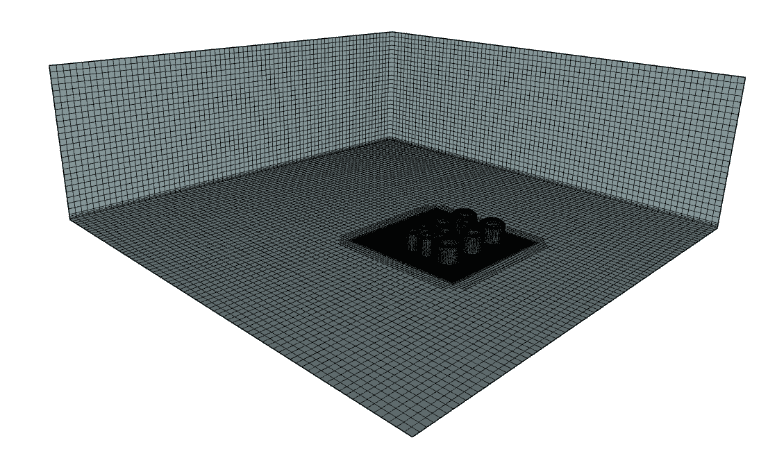
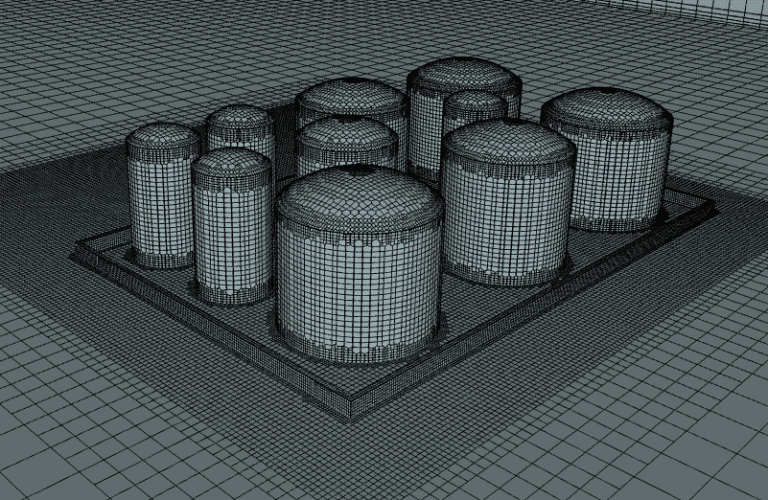
The following modeling techniques were used:
- K-omega SST turbulent model
- Steady state simulation
- Incompressible fluid
- No-slip wall conditions on floor and bodies
- Inlet velocity condition with v=36 m/s
- Outlet atmospheric pressure condition on other outer box faces
- Local refinements and boundary layers on walls
- Bounding box big enough to avoid the influence of boundary conditions on the internal flow at the region of interest
This free infographic illustrates how architects and engineers can use CFD to virtually test and optimize building designs and HVAC systems. Download it for free.
Wind Loads Results of the CFD Analysis
The turbulent 1.5M cells simulation took 86 minutes to run on the SimScale platform. Below are some plots showing the pressure distribution and flow streams:
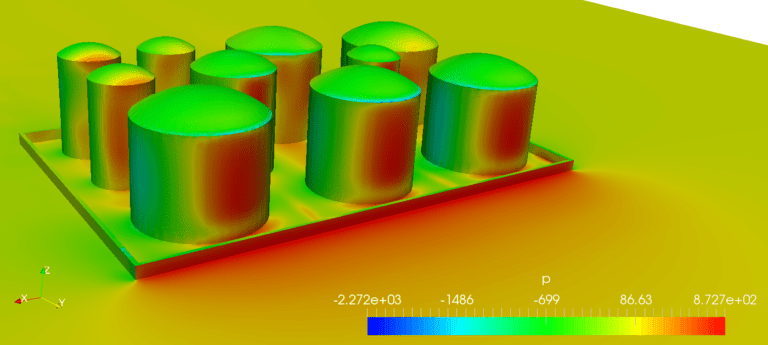
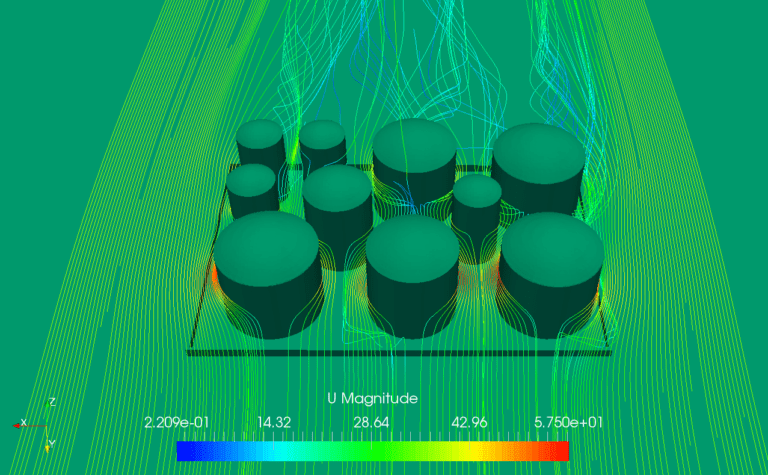
We can see that at regions of strangulation of the flow, the maximum speed tops at 57.5 m/s, a 60% rise over the gust speed. Let’s also examine in detail the pressure distribution:
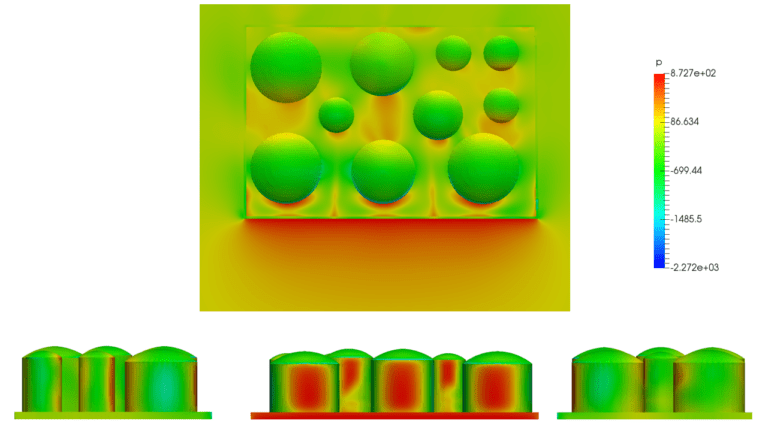
We find a maximum positive pressure of 872 Pa, and a maximum vacuum of 2272 Pa. The most important result we see is the asymmetrical pressure distribution on the walls of the tanks. This would induce moments and asymmetric stress distributions, which are different from analytical wind load calculation methods. To highlight this fact, a second simulation, which featured a single tank was carried out, with equal dimensions as one of the farm tanks, then compared to the corresponding tank in the farm:
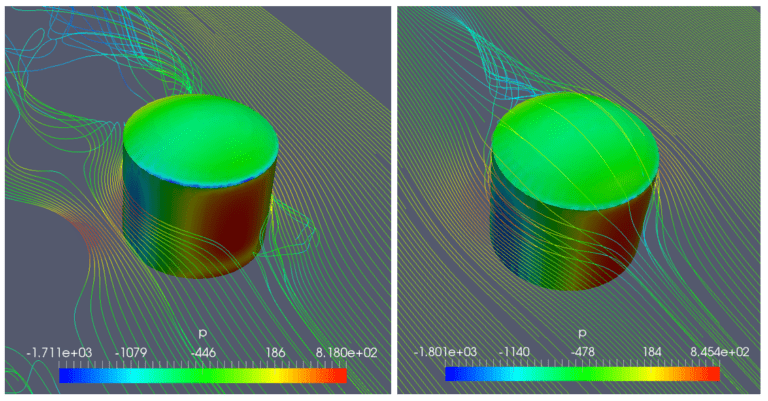
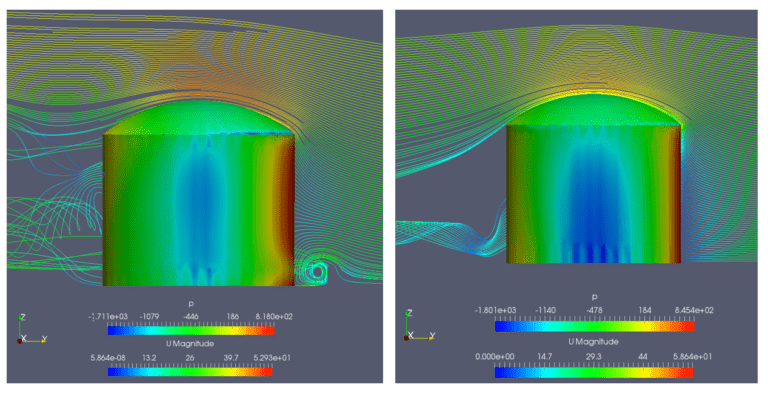
We can see that the pressure levels are lower on the oil storage tank, as expected, but that the distribution is irregular and asymmetric, so the resulting stress condition should be quite different. It is also interesting to note that in addition to the symmetry of the lone tank, a turbulent vortex developed at this flow speed. The result is that some asymmetry is to be expected in this pressure distribution, also. We can, for example, examine the total normal forces exerted on the surfaces of the tank to compare the action of the pressure:

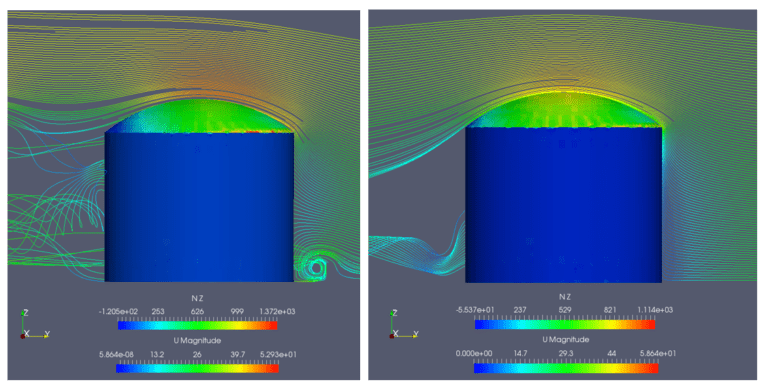
There are some interesting things we can examine here. First, the force in the X direction is not zero, which results from the asymmetries in the flows. Also, note that the total X force is higher in the farm tank case than in the solo tank case by 49%. The higher forces occur in the Z direction, and if we look at the plot, we find that it lifts the tank roof, by suction:
Wind Load Analysis Conclusions
These simulation results clearly show that designing and building tank farms, especially in regions where environmental and weather conditions are not ideal or steady, requires the use of computational fluid dynamics software. CFD provides very interesting insights on the flow around and inside the tank farm, which can inform engineering design decisions, such as placement of equipment around the tanks.
The realism of the results, with the particularities found—such as the asymmetries in loads—could be very useful for safety and reliability assessments. The next natural step in this direction is to translate the pressure loads over each of the tanks to finite element structural models to compute stress levels and safety factors. This can also be carried out with high modeling detail using the SimScale platform.
You can take a look at this tank farm simulation project and even copy it and use it as a template for your own design. Please note that this is possible with a simple trial of the Professional account on SimScale, which is free. This is how I also started using it for my consulting business and once I tested the platform, I switched to a paid account so I can use it for my customer projects. Given that the platform is cloud-based, the investment in hardware is no longer required and the subscription cost is quite fair. You can give it a try here: Plans & Pricing.
Discover all the simulation features provided by SimScale. Download the document below.


