More of my public projects can be found here.
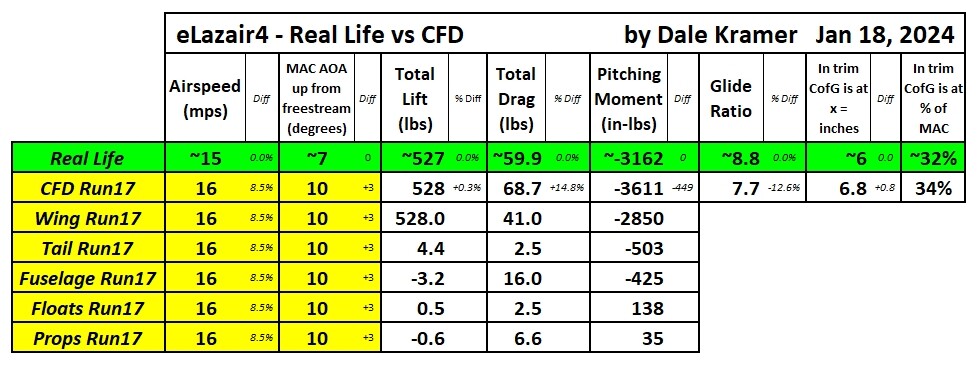
EDIT: Here are the preliminary results of my project after the below ‘Energy from the Ether’ issue was solved:
.
I will post below my summary and conclusions about the ‘Energy from the Ether’ issue soon and then I will clean up this post and present a more in depth discussion of how I obtained the above results.
But in the meantime please feel free to continue commenting this topic way down below…
.
END EDIT
.
Here is a video from my YouTube channel that shows the eLazair4 in operation from a lake near my house ![]()
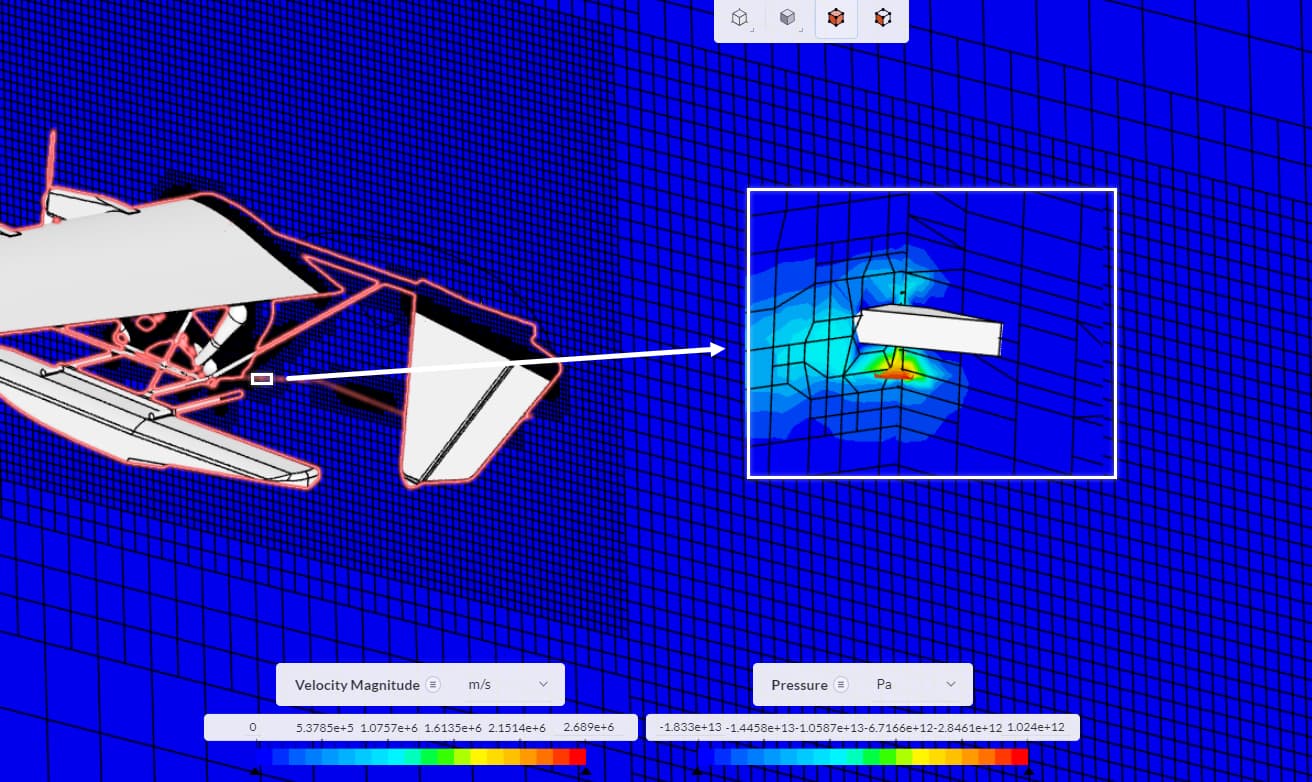
Currently I have an issue with unexpected wake behavior in this projects Run4 simulation, starting about 70m behind the eLazair4 in flight at 15 m/sec.
Here is a video which I put together that highlights this issue.
Please watch the above video link to when the spreadsheet appears.
Also note that in the video, the inlet freestream velocity is not perpendicular to the LIC circulation slices (the BMB inlet face) , the freestream air hits the airplane at a 4.5 degrees upward angle which is why the disturbances appear to rise above the vector of the airplanes path. After the correction for the 4.5 degree upward inlet air angle, the disturbance would faithfully follow expectations by going down from the vector path of the plane by ~2.5 degrees or more. Sorry for not mentioning that in the video.
@jprobst I would really like any insight you can shed on this magically appearing and significant ‘energy from the ether’ inside my wake ![]()
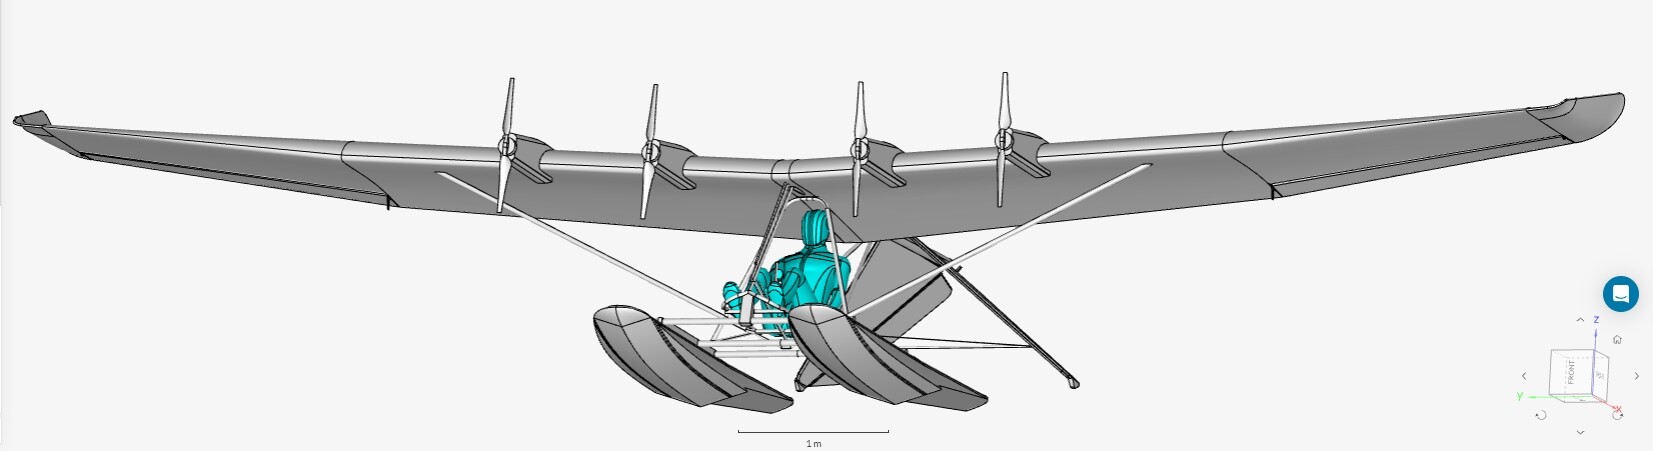
eLazair4 Detailed CAD

.
CAD used for this CFD simulation
.
LIC plot showing Wing Tip Vortices

.
SimScale yPlus Mapping whose average is 80 as determined by the yPlusHistogram program

.
The Wake Refinement Boxes inside the 16,457,241 Cell Mesh

.
yPlusHistogram Meshing Log Analysis shows 99.9% fully layered

.
yPlusHistogram showing 80 average for yPlus

.
Run4 convergence analysis using the ORSI feature of yPlusHistogram

1 Like
Hi Dale! Great to see your work here, really cool stuff.
I have shared your post with my team and asked for help. I can’t see right away what the cause might be, and it will need some deeper investigation. Stay tuned, someone should get back to you soon.
1 Like
Hi Johannes, thanks.
I have also recently found that it is also easy to see this issue by viewing X slices for the Vorticity parameter with LIC lines representing circulation flow lines.
Here is a link to a video of those Vorticity slices with LIC lines.
I think you can easily see this energy start to appear around 155 meters behind the tail in the Vorticity slices.
Also, I know that I have not fully captured the full wake extent with my wake box sizes but these were my 1st off guess sizes. Also I should have had a few more meters between the farthest downwind wake box and the rear of the BMB, but I don’t think those issues would affect much the size of these strange disturbances in the wake. Also, I am trying to conserve core hours at this point of the investigation.
1 Like
I have made a new video of Vorticity X slices with LIC lines as follows:
- I have rotated the slicing planes so that they are perpendicular to the free stream inlet velocity. This has created better LIC flow circulation lines showing 2 lower vortices, not evident before, forming (at about 178 meters) in the area where energy is seeming to be introduced to the wake which is from about 155 meters behind the tail and further.
- I have made the camera view Normal to the slicing plane to ensure complete alignment to the free stream velocity.
- I have rescaled the color map for vorticity to highlight the wake vorticity towards the rear of the wake boxes.
1 Like
Hello Dale,
very interesting project, investigation, and analysis.
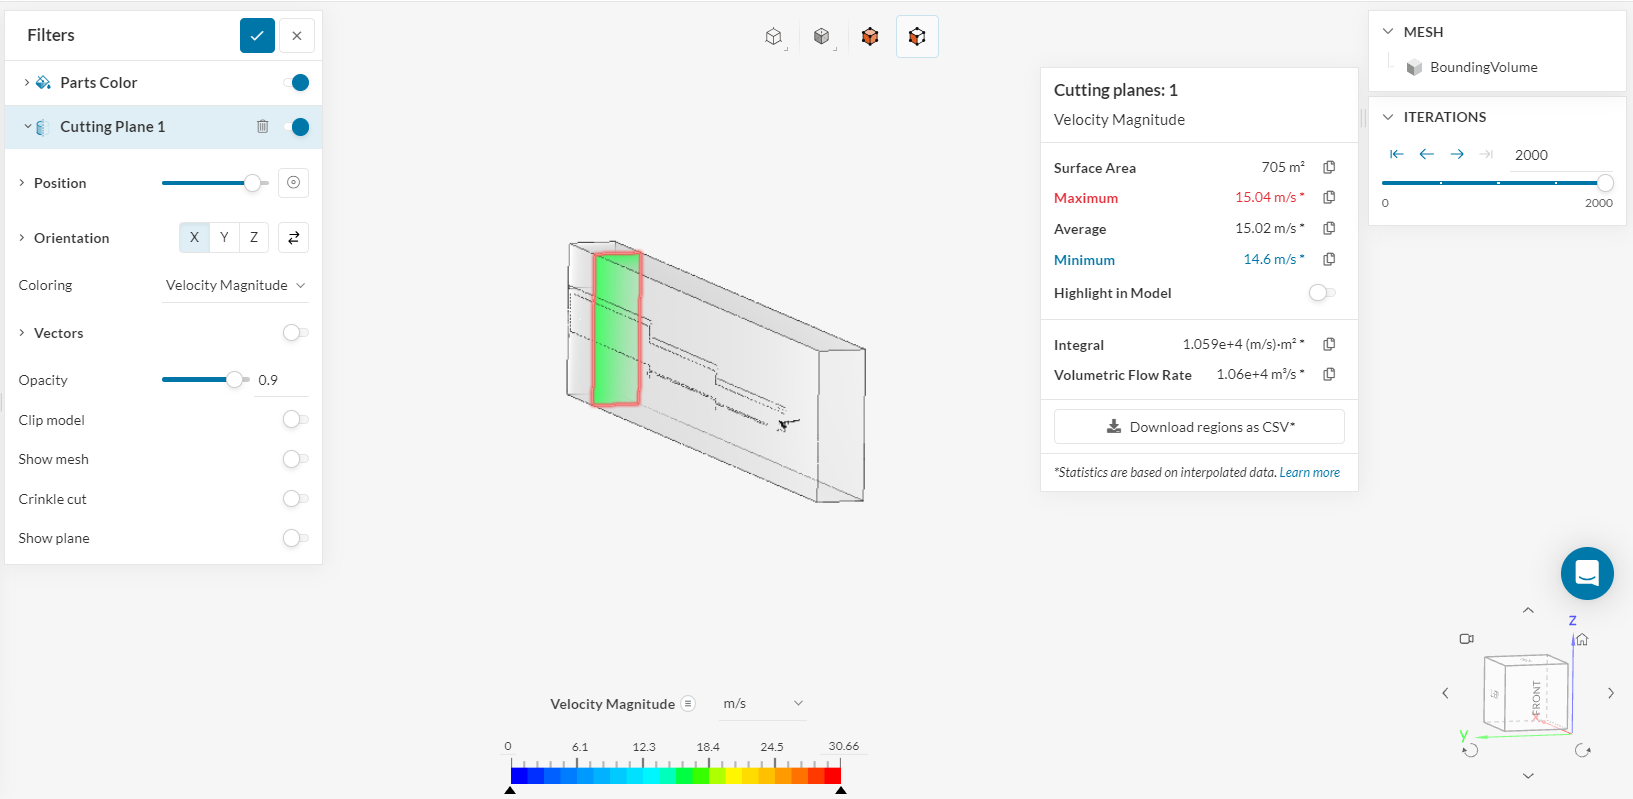
I had a look at your project and checked for the posted issue with the average slice velocity not approaching 15 m/s.
Here are my findings.
- Abs Residual Values / Simulation convergence

I noted that in your simulation the maximum residual was still above 1e-4.
We recommend considering a simulation converged, that the residuals should be at least below 1e-3 better lower than 1e-4. With regards to the low-velocity plume, my guess was that the plume we see, is still from the beginning of the simulation, that has not yet left the flow domain.
Considering this there are two options on how to improve this.
- could be that further iterations are needed to reach convergence, currently you only ran for 1000 iterations.
- Mesh improvements
When further interaction does not change the converged residual, mesh improvements need to be done to lower the residuals. - Initialization of the simulation.
This won’t help with the final residual, but it can help with a faster convergence of the result.
Improvements.
I have created a new run based on your project and checked for the interaction time, together with some boundary changes based on your best practice suggestions.
Running the simulation for 2000 Iterations shows an improvement in the residuals after 1700 iterations.
The residuals now reach a value below 1e-4.
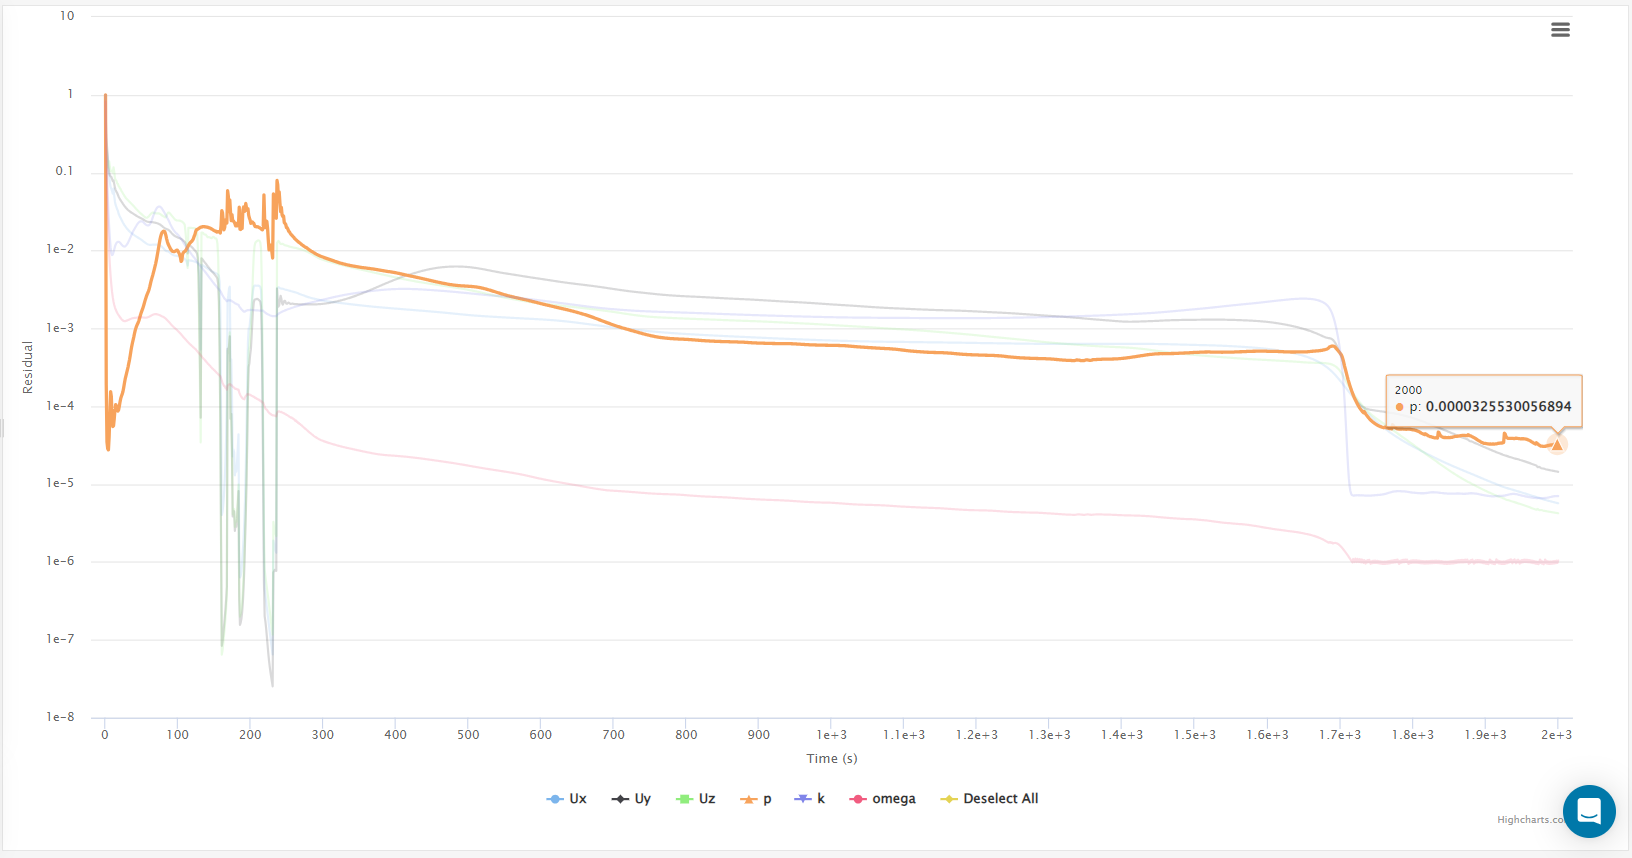
In addition, I took a write-out of the simulation field every 500 Iterations to investigate on the plum theory.
The below gif shows an ISO-Volume in the range of 0-13 m/s.
We can see how the wake plume is reducing with the iterations and is finally gone after 2000 iterations.
Also now the average far-field velocity is at 15m/s.
Therefore I’d recommend you continue your simulation for further iterations, to remove the plume, or initiate your simulation with the velocity conditions from your inlet.
Please let me know if you have any further questions.
Best regards
Sebastian
1 Like
This is great news Sebastion! It will take me a while to fully respond and to make some conclusions.
I find it really interesting that we both seem to have headed in the same direction.
Hi Dale,
I’m always happy to help and, please keep me updated on your findings.
With regard to the initial conditions, I’m just running the case.
As for Run 1, I just have changed the overall run time, as well as the BC for the symmetry and Pressure outlet condition.
In addition, I’d suggest also writing out every 500 Iterations so that you have some visual checkpoints available. Or creating some wake probe points monitoring the convergence there.
Best,
Sebastian
I also changed the pressure outlet condition but I think I will stick to using slip walls as my symmetry plane BC. Years ago I convinced myself that there was no difference in using a slip wall vs a symmetry plane BC as discussed here.
I am happy using the ORSI feature of yPlusHistogram to monitor convergence in real time for all my forces results. For instance, on your current run called ‘Initial conditions’, the unrotated ‘Pressure force z’ of 1097 N for all 406 geometry faces is currently pretty stable at 512 iterations (in fact 0.79% stable for 200 iterations of a 50 point moving average) as you can see here:

Now I have to figure out how you did that…
P.S. In real time I can stop my sims when the forces are stable to my exact liking and when residuals are low enough without having to write every 500 iterations since a full data set always seems to be written when I stop the sim run manually.
1 Like
Hi Dale,
yes, I agree the forces are converging pretty fast.
With regards to my run, I also turned off the potential flow initialization, and I just went with the initial conditions, as the potential flow initialization didn’t create a good result IMO.
Best
Sebastian
1 Like
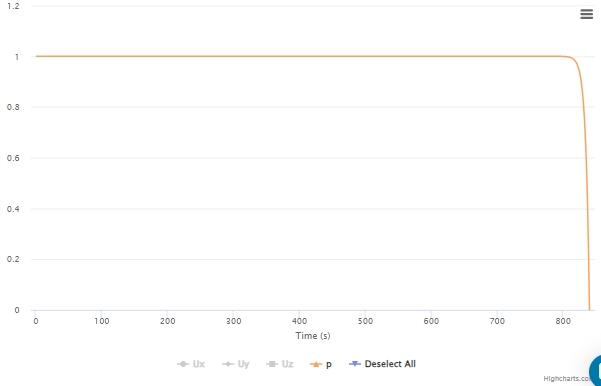
Hi Sebastion. Before I develop my presentation of the solution to the mystery energy issue, I wanted to run a mesh with a larger BMB and better wake box sizes. I now have a good mesh for that but I am getting a diverging simulation whose residuals look great up to about 700 iterations (all parameters less than 6e-5) . Then divergence appears. I have read about the new convergence plots here, but although the Walls and Outlet Plots appear to ‘see’ the divergence issue much earlier I still do not know how to interpret them. What can you suggest to beat this divergence?
Hi Dale,
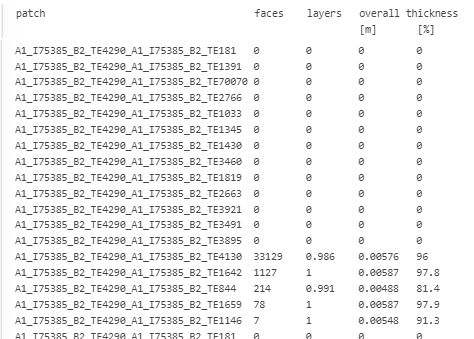
the simulation diverged at the rear support structure.
The issue here is that no BL has been created, which caused the simulation to diverge.
I’d suggest either removing this small feature or improving the mesh quality.
Also taking a look at the meshing log, there are a lot of faces for which no BL were created.
I hope this helps you to investigate the mesh.
Best regards
Sebastian
Yes I purposely did not add layers on geometry that quickly produces turbulent flow to keep my mesh size smaller like crosswind tubing and the pilot etc. I have found in the past that the solvers do treat all geometry with basic wall function formulas and the yPlus surface mapping of those unlayered faces does seem to fall into the wall function region and layering in separated flow does not add much of anything to the lift and drag forces results.
I just got up and saw that my solution fields had finally appeared after I stopped the run late last night. Your post magically appeared just as I was about to go looking for the divergence in the solution. Thanks for saving me the effort (but I should learn the SimScale post processor better for these types of issues)! I was hoping to learn more about the new convergence plots tho ![]()
For now I think I will just try to re-mesh that location since I have been able to mesh it well in the previous mesh. I think there is just a weird edge discontinuity in the mesh where the level 10 cells did not exactly follow a surface edge (a meshing algorythm bug I have complained about years ago).
I see let me try to elaborate on this.
The Domain, Inlet, Outlet, and Wall report, provide you with a normalized plot of the residuals.
As these reports are normalized the convergence towards a constant value is the most important.
The Residual plots provide you with an average value of the Region residuals.
As this one is not normalized the overall value as well as the convergence is important.
With respect to detecting the divergence earlier, I’d say that this is the earliest visual in the residual plot.

Please let me know if you have any open questions.
Best Sebastian
I hope you don’t mind if we delve a little deeper into the details of this ‘Normalization’ that is taking place…
Are you saying that this plotted dataset of Normalized values in my Walls Convergence Plot:
is created from this dataset of my Residuals Convergence Plots’ values and that the Max and Min values used in the Normalization formula are the Max and Min of my Residual datasets’ values over the Residuals datasets’ full range of iteration values (0 to 840) ? :
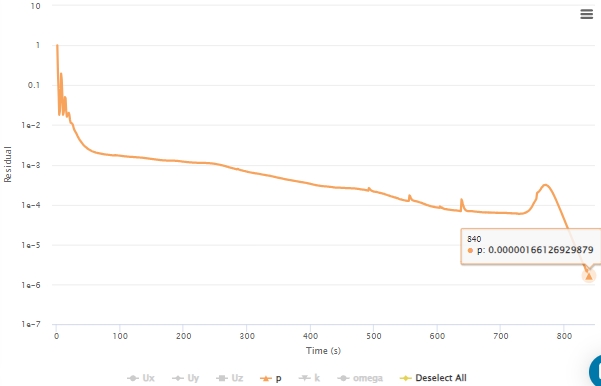
EDIT: I am a big fan of normalized data but I would like to see the exact derivation formulas of these values so I can understand how to interpret them.
Here are my preliminary results after the ‘Energy from the Ether’ issue was solved:
.
I will post my summary and conclusions about the ‘Energy from the Ether’ issue soon and then I will clean up clean up the top post of this topic and present a more in depth discussion of how I obtained my results there, but feel free to continue to comment here in the meantime…